
San Francisco and San Mateo were the last Bay Area counties to land on the state’s coronavirus watch list, which monitors counties for troubling patterns in virus data and adds restrictions to reopening. While cases are surging in hot spots bordering the Bay Area, San Francisco and San Mateo’s numbers paint a different, if still troubling picture — one that’s true for much of the Bay Area: Their numbers consistently hover just above most of the data thresholds that indicate the spread of the virus is under control, preventing them from coming off the watch list.
California is looking for counties to keep their 14-day case rate, or the number of confirmed cases per 100,000 people, under 100.
In San Joaquin County, which borders the Bay Area, the case rate is 308, and the county is reporting a positive test rate of 17.5%. Kern County farther south has a case rate of 429 and a positive test rate of 19.2%. By comparison, San Francisco’s case rate stands at 106, and it is posting a positive test rate of 3.9%.
Dr. Peter Chin-Hong, an infectious disease expert at UCSF, said that while all Bay Area counties should be on the watch list according to the state’s strict guidelines, he doesn’t think the measurements are as finely tuned as they could be.
“Being on the watch list is a crude measure of risk,” he said. “What might be more useful is a traffic light designation: red, amber and green.”
He said California is basically three separate “countries” now: Southern California, which was initially the state’s hot spot; the Central Valley, whose worrying surge is comparable to states such as Texas and Florida, and the Bay Area, which was doing well at the beginning of the pandemic but has worsened overall.
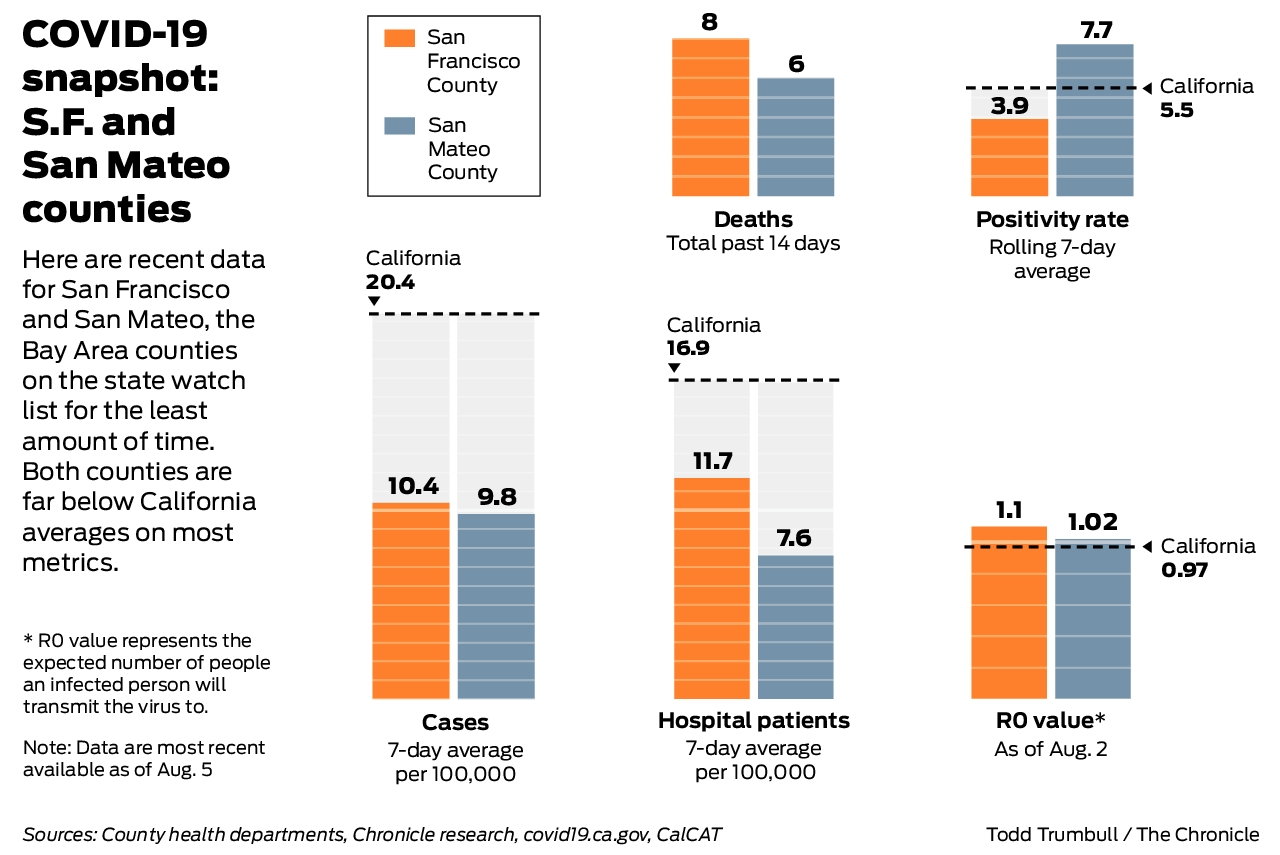
Here’s a look at the data showing how San Francisco and San Mateo counties compare on the state’s key data benchmarks, and other factors that determine whether cases are increasing.
Cases
As of July 30, according to the DataSF.org dashboard, San Francisco’s 7-day average of new daily cases per population of 100,000 is 10.4, which translates to about 91 new daily cases. Anything above 6 per 100,000 is considered a level 4 high alert, and the goal is to decrease the number to 1.8. At its peak, that number was 14.3 for San Francisco, so it is declining but still high according to the county’s measurements. In San Mateo County, the latest reported rate is 9.8, or about 75 new daily cases. Both are well below the state average of 20.4.
San Francisco was added to the state’s watch list on July 17 because of elevated coronavirus infections and hospitalizations, with the city’s Latino population disproportionately affected. Increased social gatherings, especially among people in different households, increases in economic activity, and continuing infections in low-income housing and among low-wage essential workers have all been cited as drivers of the increase in cases.
San Mateo County joined the list amid rising infections and hospitalizations. The county unsuccessfully tried to negotiate with the state to avoid restrictions, but on Aug. 1 was forced to shutter indoor operations of salons, gyms and churches.
The state has tied the rise in community transmission in San Mateo to social gatherings where participants didn’t wear face coverings or practice social distancing, workers coming more frequently into contact with others, and crowded home living conditions. On Tuesday, the San Mateo County Board of Supervisors voted unanimously to impose fines on individuals who refuse to wear masks.
Hospitalizations
San Francisco’s 7-day average of hospitalizations per population of 100,000 is 11.7, according to the California COVID-19 Assessment Tool. The county’s hospitalizations have been increasing gradually since June 19, hitting a pandemic high of 109 hospitalizations on July 29.
But according to the rate of weekly change in COVID-19 positive hospitalizations, which reflects the demand on hospitals for acute and intensive care, San Francisco is at 9%, within the target of less than 10%. San Mateo County reports a rate of 7.6%. Both counties fall well below the state average of 16.9%.
Deaths
San Francisco most recently reported a total of 62 deaths since the pandemic began. The county has seen eight new deaths over the course of two weeks, based on the most recent data reported on Aug. 2.
San Mateo County has reported 120 total deaths, and recorded six new deaths in the past two weeks, based on the most recent data reported Aug. 4.
Positive test rate
San Francisco maintains a low positive test rate, meaning the percentage of tests showing coronavirus. The latest number is 3.9%, according to the city dashboard, compared with the state average of 5.5%.
San Mateo’s positive test rate is higher at 7.7%, but still within the 8% threshold that the state wants counties to stay below.
Chin-Hong said with the mobility of Californians and San Mateo County’s geographic area, it’s unsurprising it eventually landed on the watch list, especially because it was the last Bay Area county still allowing services including haircuts and the use of indoor gyms.
“Unless San Mateo County magically put a fence around them, they were not going to stay off the watch list,” he said. “This is what happens when one place becomes a sanctuary. It becomes a magnet for surrounding counties to visit, and you bring the risk of your county with you.”
‘R0’ Score
In epidemiology, the so-called “R0” score (pronounced R-naught) shows the expected number of people an infected person will transmit the virus to. So an R0 of 1 means each infected individual will pass the virus on to one person. To slow down spread, the R0 needs to drop below 1.
According to the state COVID Assessment Tool, San Mateo’s R0 score is 1.02 — just above the critical threshold of 1. San Francisco's is 1.1, which is defined as indicating the virus is “likely increasing.” California’s R0 is just below 1.
Kellie Hwang and Mike Massa are San Francisco Chronicle staff writers. Email: kellie.hwang@sfchronicle.com, mmassa@sfchronicle.com
"last" - Google News
August 06, 2020 at 06:00PM
https://ift.tt/31utzPW
SF and San Mateo were last in Bay Area on the coronavirus watch list. What do numbers show now? - San Francisco Chronicle
"last" - Google News
https://ift.tt/2rbmsh7
https://ift.tt/2Wq6qvt
Bagikan Berita Ini


0 Response to "SF and San Mateo were last in Bay Area on the coronavirus watch list. What do numbers show now? - San Francisco Chronicle"
Post a Comment